Populations
Class Powerpoint slides. Click below to open the slides
| populations.pptx |
What determines the size of populations?
Size is affected by four factors: Birth, Death, Immigration & Emigration.
Population change = (birth - deaths) + (immigrants - emigrants)
Size is affected by four factors: Birth, Death, Immigration & Emigration.
Population change = (birth - deaths) + (immigrants - emigrants)
Test your understanding
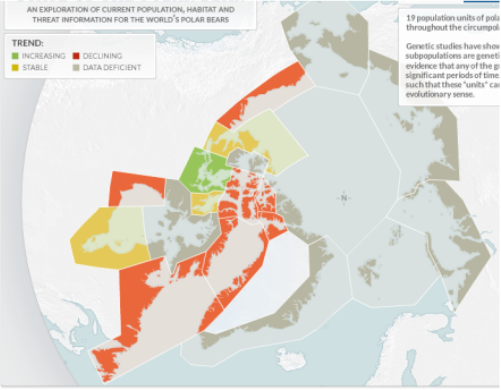
The below image relates to the Polar Bear population status in May 2014.

|
Question 1.
Looking at the Data, Estimate the population range of the Polar Bears (Min. estimated numbers to max. estimated numbers)? Question 2. a. From the data, where is the Density of the Polar Bears the highest? b. Give 3 reasons why this area might have higher numbers of polar bears than other areas. c. Where is the abundance of polar bears lowest? d. Why might it be difficult to estimate the population of Polar bears in the region of AB? Question 3. Explain the distribution of the polar bears. Relate this distribution to habitat, food sources, competition and environmental factors |
|
Question 4.
a. The data on the left indicates that there has been a shift in the distribution of the polar bear populations? Explain this change. Question 5. How might this change in the distribution of the polar bear populations be related to the image below of the Artic Ice levels? 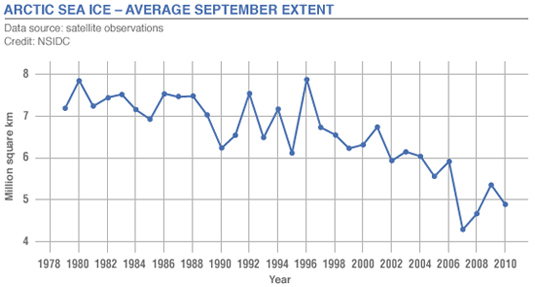
|
Predator Prey relationships

The Graph above indicates the population of wolves and Moose in Yellowstone National Park.
Please answer the following questions on the Worksheet Provided below:
Sample answers for these questions:
|
All finished? | ||||
Population sampling
Population sampling
Purpose: to estimate the populations of organisms without having to count them all - helps us to measure Distribution and abundance (Population Structure)
Sampling tells us
When measuring populations:
We must consider the following elements
Precision: How repeatable is our estimate? Can this result be re-created by someone else?
Bias: Have we sampled the area in a way that is creating bias (for example- measuring the numbers of frogs in a forest. Measuring in the valley vs. measuring up the mountains)
Accuracy: How close to the true average is our estimate? (If billy planted 400 tomato plants in his field- could you accurately determine this through your sampling?)
- Accuracy is dependent on population distribution (Uniform, random & clumped)
- clumped and random distribution may be more difficult an accurate population through sampling
Quadrat sampling
With sampling, we always use a plot that we can replicate (1x 1m or 100mx100m plot) . This allows us to measure Absolute Density within a given area
Absolute Density: Number of individuals per unit of area within a study site
Quadrat sampling is either Random Or representative
Random Sampling: Is not the same as haphazard sampling (random number generator- number relates to a plot on the table)
We use this when we have lots of quadrats within an area
Representative Sampling:Areas chosen deliberately when we can only chose a few quadrats
Systemic Sampling
Line Transect: This is a line or strip laid across the area
Also used to estimate animal populations - type and size depend on the animal
Allows us to identify density of a population within an area
Things to consider regarding accuracy of sampling:
What factors might affect population dispersion within an environment (Abiotic factors, Biotic Factors)
Biotic Factors: Non-Living Components (Rain, wind, temperature, altitude, salinity, soil, polution, pH, nutrients, sunlight )
Abiotic Factors: Living components (Plants, animals, bacteria, fungi ect;) - competition for a niche
Purpose: to estimate the populations of organisms without having to count them all - helps us to measure Distribution and abundance (Population Structure)
Sampling tells us
- Population of a given species
- Density of populations
- Species diversity
- Age structure
- Pre-reproductive
- Reproductive
- Post-reproductive
- Distribution/ Dispersion
When measuring populations:
We must consider the following elements
Precision: How repeatable is our estimate? Can this result be re-created by someone else?
Bias: Have we sampled the area in a way that is creating bias (for example- measuring the numbers of frogs in a forest. Measuring in the valley vs. measuring up the mountains)
Accuracy: How close to the true average is our estimate? (If billy planted 400 tomato plants in his field- could you accurately determine this through your sampling?)
- Accuracy is dependent on population distribution (Uniform, random & clumped)
- clumped and random distribution may be more difficult an accurate population through sampling
Quadrat sampling
With sampling, we always use a plot that we can replicate (1x 1m or 100mx100m plot) . This allows us to measure Absolute Density within a given area
Absolute Density: Number of individuals per unit of area within a study site
Quadrat sampling is either Random Or representative
Random Sampling: Is not the same as haphazard sampling (random number generator- number relates to a plot on the table)
We use this when we have lots of quadrats within an area
Representative Sampling:Areas chosen deliberately when we can only chose a few quadrats
Systemic Sampling
Line Transect: This is a line or strip laid across the area
- These are useful for identifying changes in vegetation within the environment (ie; vegetation along the shoreline from the ocean to a row of houses)
- Helps to visualise zones- mark the line at fixed intervals
- Measures abundance
- Helps to determine distribution of organisms throughout a region
- May not transect populations of some organisms
- Will only work for vegetation or very slow moving organisms
Also used to estimate animal populations - type and size depend on the animal
Allows us to identify density of a population within an area
Things to consider regarding accuracy of sampling:
- Measurement Error ( have you missed some plants or organisms?) - organisms below ground
- Total area Sampled (The more area the more precise the estimate)
- Population Dispersion (Where do different plants live? Are they aggregated, evenly spread or randomly positioned?)
- Size and shape of the quadrat
- Position within the sample area that the quadrat is placed (did you specifically pick an area because it looked interesting or because it was small and easy to count?)
What factors might affect population dispersion within an environment (Abiotic factors, Biotic Factors)
Biotic Factors: Non-Living Components (Rain, wind, temperature, altitude, salinity, soil, polution, pH, nutrients, sunlight )
Abiotic Factors: Living components (Plants, animals, bacteria, fungi ect;) - competition for a niche
|
Key Terms:
Ecology The study of inter-relationships between organisms and their environment Abiotic – non living components Biotic – living components The supporting layers of land, air and water that surrounds the earth is called the biosphere. Ecosystems Made up of all the interacting abiotic and biotic features of a specific area Species are made up of many groups of individuals called populations. Populations A population is made up of all the interbreeding organisms of one species in a habitat Boundaries of populations can be difficult to define Populations of different species form a community |
Community A community is made up of all the different populations of different species living and interacting in a given place at a given time. Habitat A habitat is a place where a community of organisms live. Ecological niche Describes how an organism fits into its environment Refers to where an organisms lives and what it does there Includes all biotic and abiotic requirements for an organism to live No two species will occupy the exact same niche |
Review Question Answers:
Q1. B Q2. C Q3.B Q4.A Q5.C Q6.D
Q7 a. Zero population growth means that there is no change in the total number of magpies in the population. This means that the sum of the births and the number of magpies immigrating to the population must be equal to the sum of the number of magpie deaths and number of magpies emigrating from the population
b. This may not be true. If for example the birth rate was very low the death rate may also be very low to result in zero population growth. Rates of immigration and emigration of the magpie would also need to be taken in to account.
